Vibrational relaxation of chemically inert air behind a shock
Description
There are two examples in this directory. These examples show the computation of inert air (non-chemically-reacting) relaxing behind a strong shock. The free stream air approaches the shock a Mach 25 and the air is initially at 205.0 K. The two examples condsider: (1) the relaxation due VT energy exchanges only; and (2) the relaxation due to both VT and VV energy exchanges. These test cases appear in a paper on modelling nonequilibrium processes for hypersonic flows by Thivet, Perrin and Candel (1991). These calculations were presented in the author’s thesis in Section 5.5.2 as a verification of the implementation of vibrational relaxation models.
This example is found in the code collection at:
$CFCFD/examples/poshax3/thivet_et_al
Reference
Thivet, Perrin and Candel (1991) A unified nonequilibrium model for hypersonic flows. Physics of Fluids A, 3(11):2799–2812
Files
User-built files:
- example-1.inp
- Input file for Poshax3 to compute example 1.
- example-2.inp
- Input file for describing the gas model.
- run-example-1.sh
- A script to execute example 1 and plot the results.
- run-example-2.sh
- A script to execute example 2 and plot the results.
- plot-example-1.gplot
- A Gnuplot script to plot example 1 results and compare to Thivet et al.
- plot-example-2.gplot
- A Gnuplot script to plot example 2 results and compare to Thivet et al.
Gas model input file:
- inert-air.lua
- Gas model input file for a 3 mode model of inert air. Species considered are O2 and N2. Three thermal modes are included: transrotational, O2-vibrational, N2-vibrationl.
- exchange-VT-only.lua
- Energy exchange file which considers only exchange of energy from vibrational to translational modes.
- exchange.lua
- Energy exchange file which considers VT and VV exchanges amongst the thermal modes in inert air.
Output file:
- example-1.data
- Output file from Poshax3 calculation. This contains flow properties as a function of distance downstream of the shock. This file is only available after running the calculation.
- example-2.data
- As above but for example 2 calculation.
Data files:
- thivet_etal_fig5_??.endata
- Temperature data taken from Fig. 5 of Thivet et al.
Results files:
- example-?.pdf
- Plots of temperature profiles behind the shock.
Running the simulation
The steps to running and plotting results are contained in the scripts: run-example-?.sh.
This can be executed at the command line, from this working directory as:
> ./run-example-1.sh
Results
The temperature profiles behind the shock are plotted up to a distance of 5cm downstream. For example 1, in which only VT exchanges are considered, the temperature profiles are shown in the following figure.
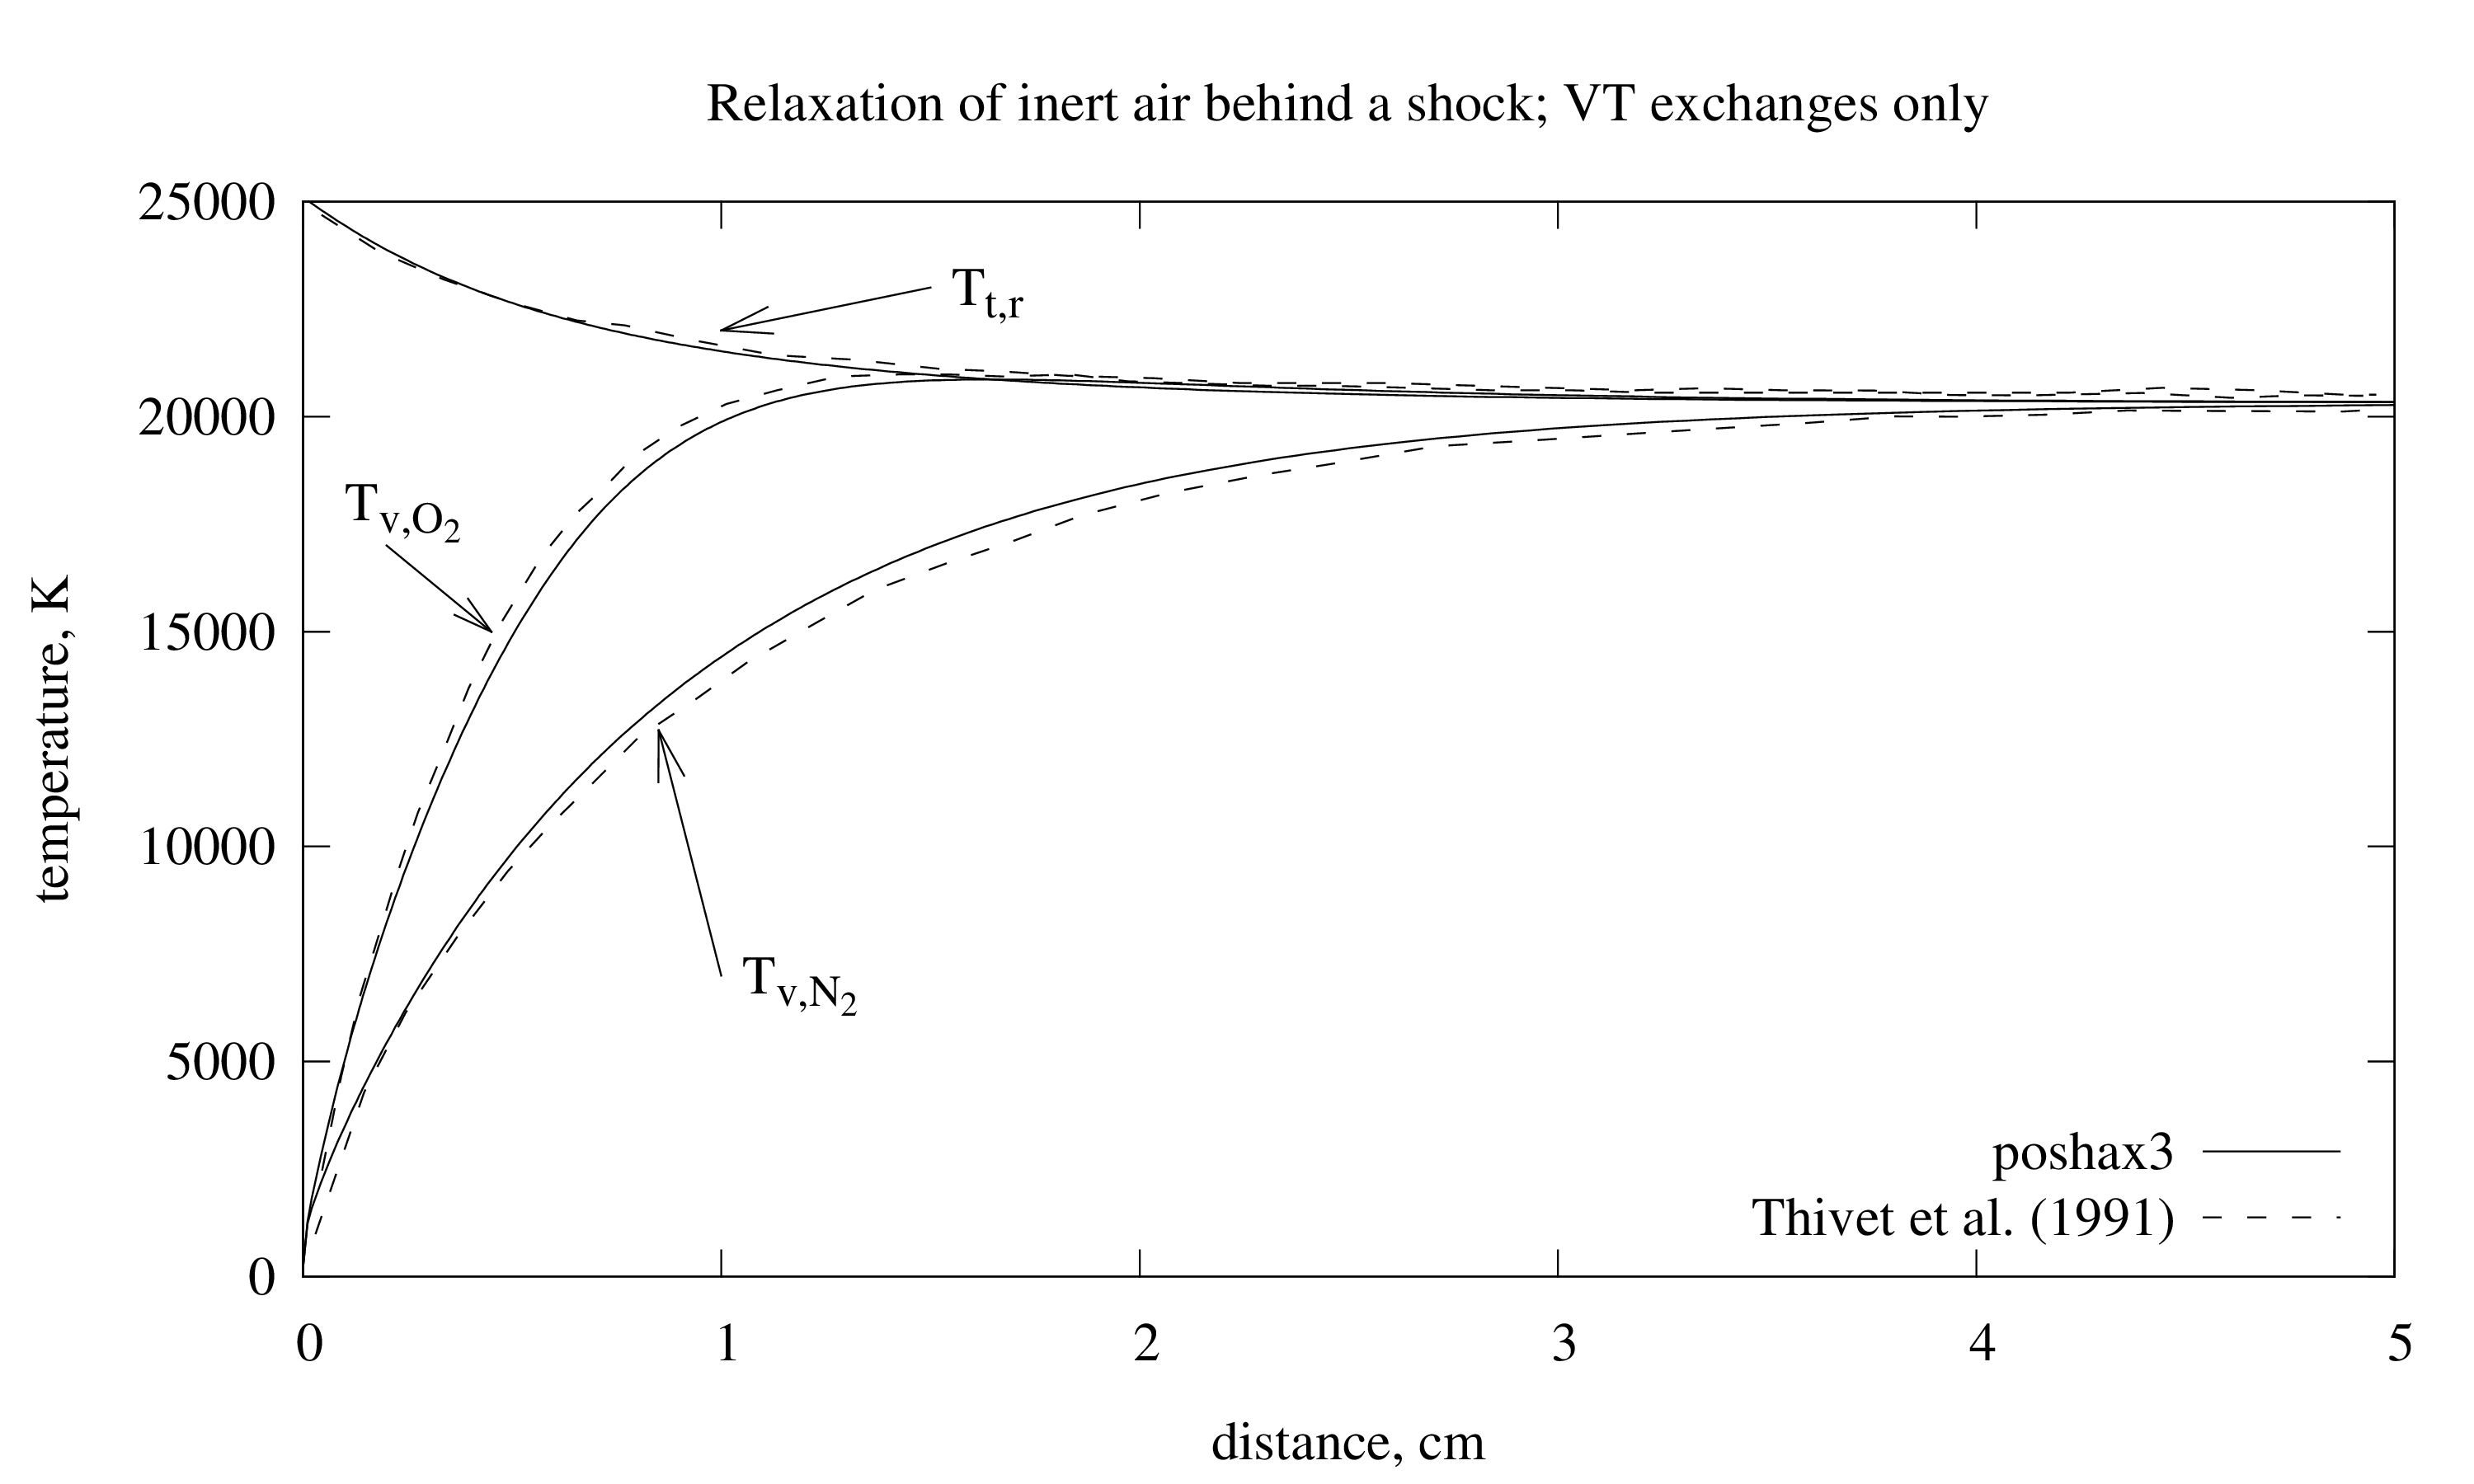
Temperature profiles behind a normal shock in air at Mach 25. The air is treated as chemically inert and only VT energy exchanges are modelled.
The next figure shows the results for example 2, which include VV energy exchanges also. When compared to VT exchanges only, thee effect of the VV energy exchanges is to delay the relaxation between the vibratonal modes and the translational mode. Also, the VV exchanges give a mechanism for the two vibrational temperatures to relax against each other. So, the equilibriation amongst the two vibrational modes occurs quicker.
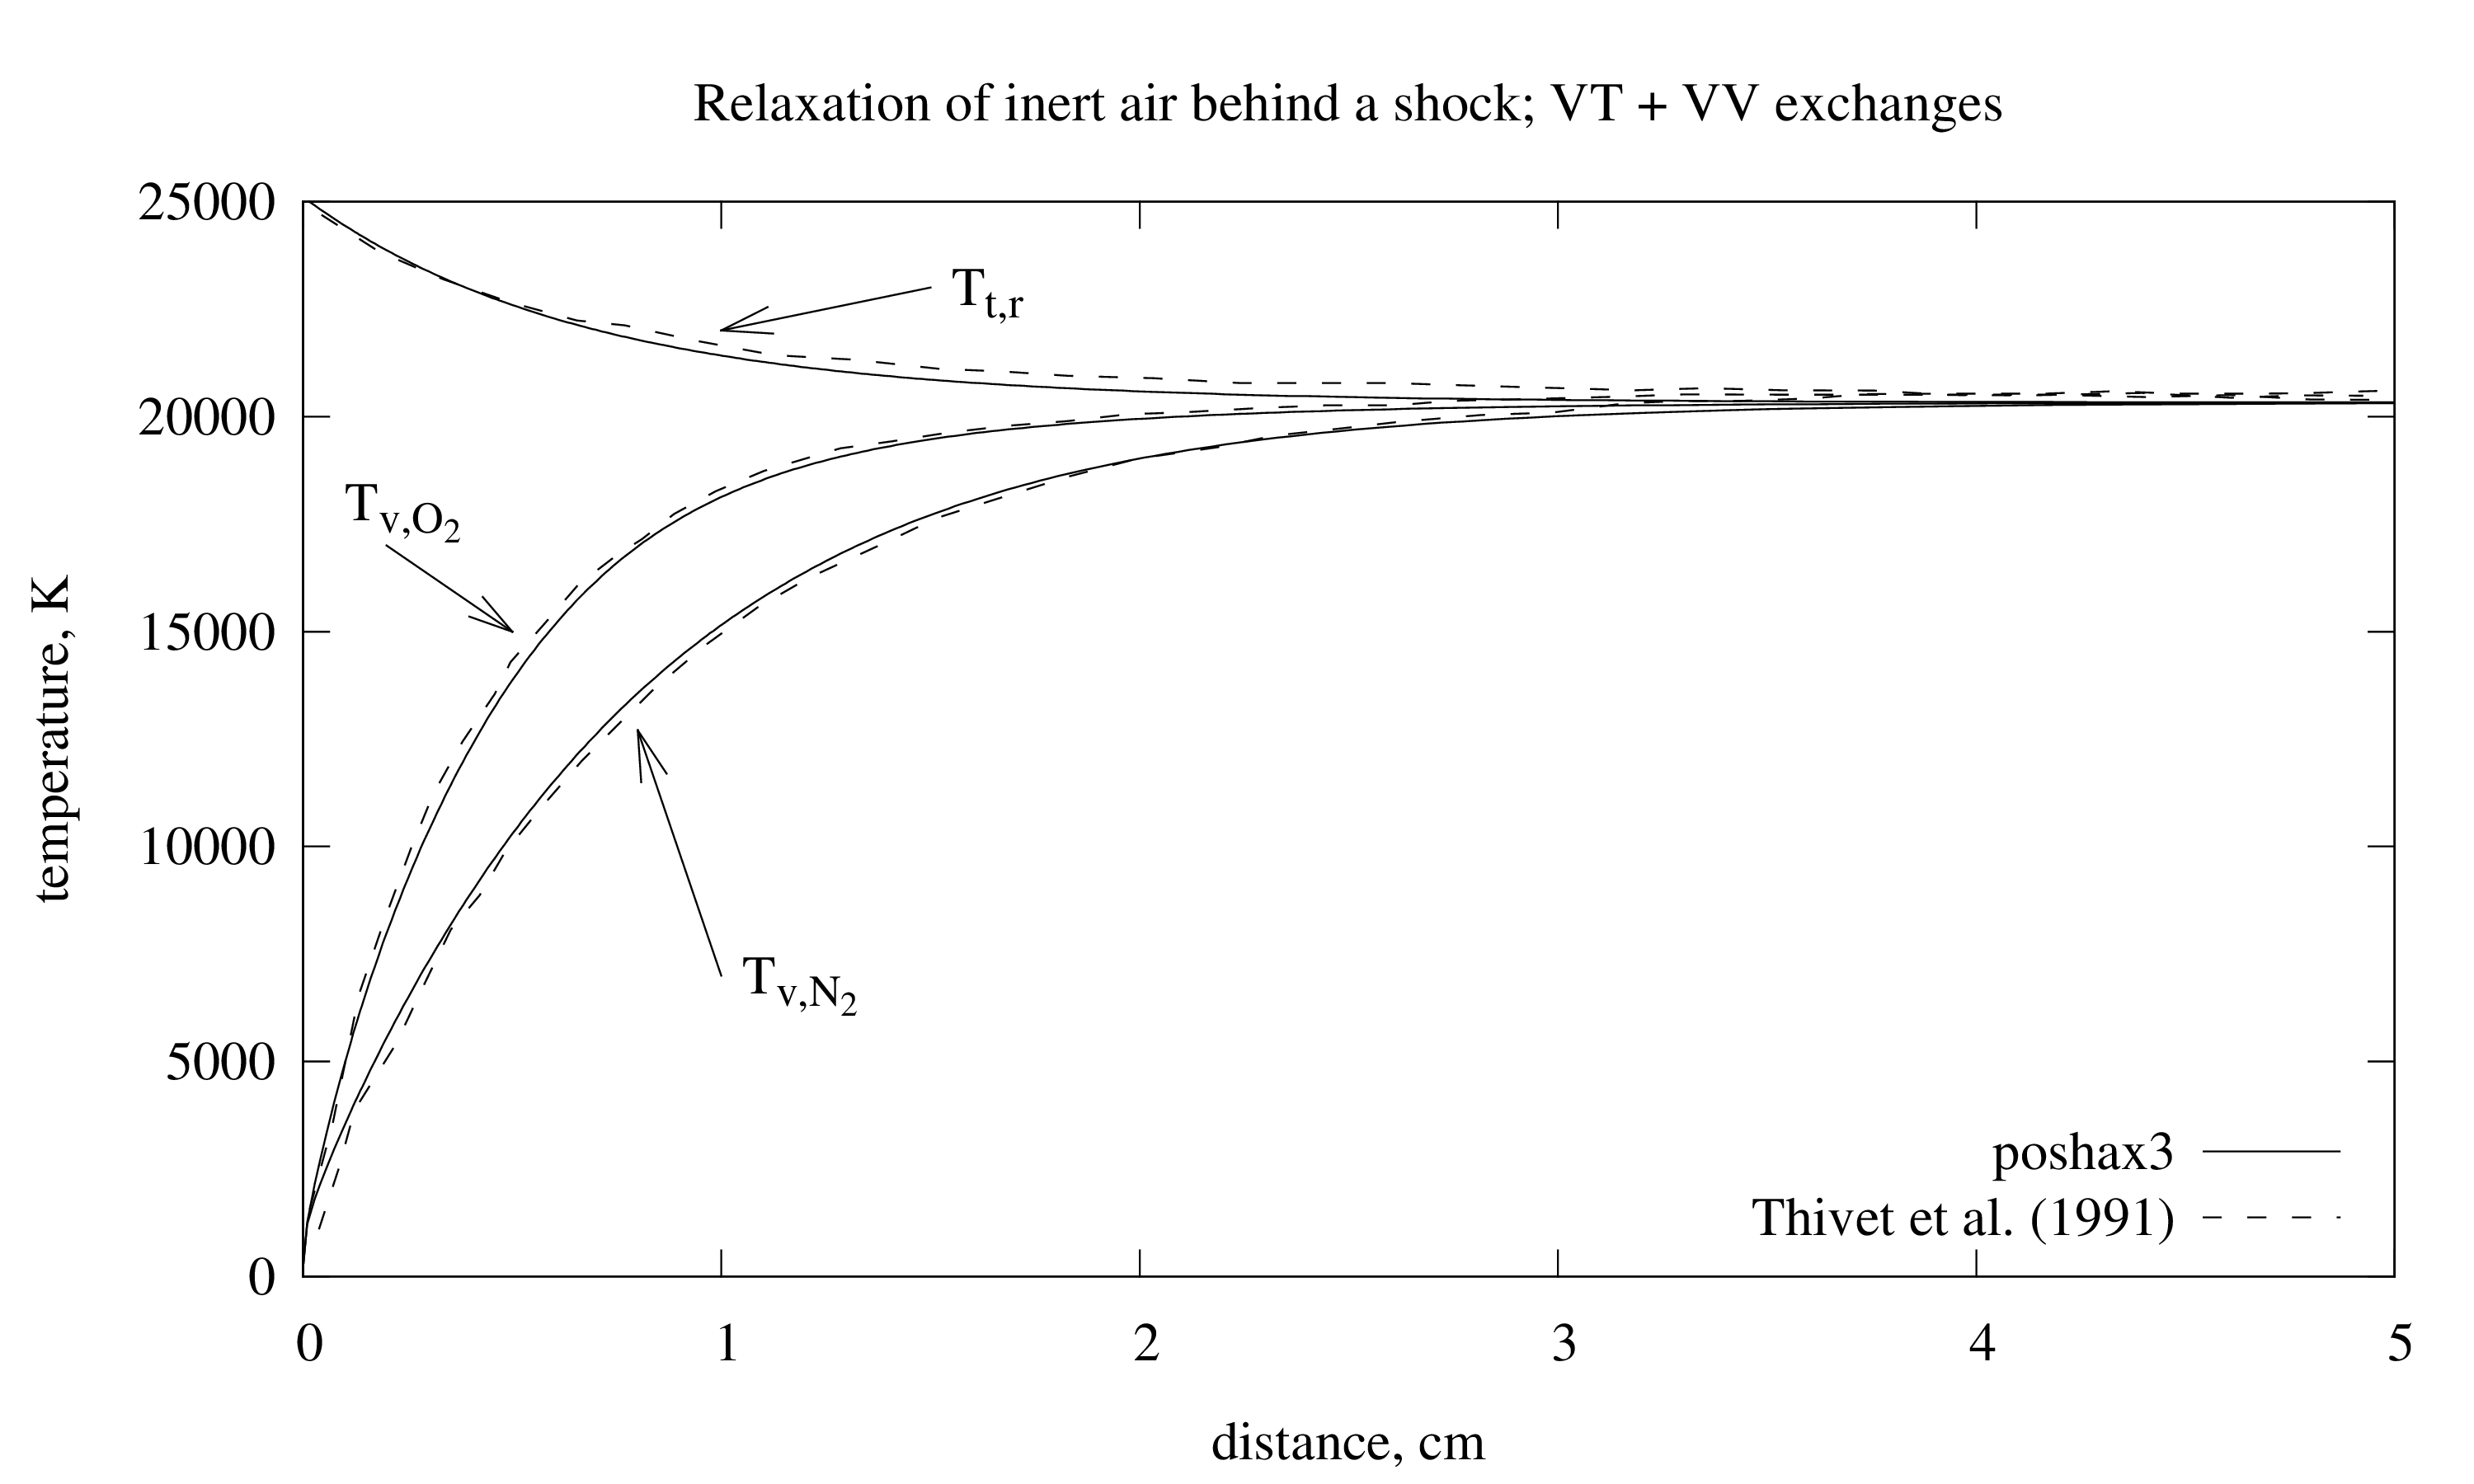
Temperature profiles behind a normal shock in air at Mach 25. The air is treated as chemically inert and only VT and VV relaxation energy exchanges are modelled.