Relaxation of chemically-reacting air behind a shock
Description
This example computes the relaxation of air due to chemical reactions which occurs behind a strong shock. The free stream air is travelling at Mach 12.3. This calculation was first presented by Marrone. The calculation presented here uses a newer set of reaction rates as compared to those used by Marrone. The details of this calculation can be found in Section 4.4.2 of the author’s thesis.
This example is found in the code collection at:
$CFCFD/examples/poshax3/air-Mach-12.3
Files
User-built files:
- air-Mach-12.3.cfg
- Input file for Poshax3.
- air-model.inp
- Input file for describing the gas model.
- gupta_etal_with_Keq.lua
- User-built input file containing chemical reaction rates.
- run.sh
- A script to execute the example and plot results.
Gas model input file:
- air-model.lua
- Gas model input file for direct use by Poshax3. This
file is created using the
gasfileprogram.
Output file:
- air-Mach-12.3.data
- Output file from Poshax3 calculation. This contains flow properties as a function of distance downstream of the shock. This file is only available after running the calculation.
Data files:
- marrone_fig3_??.g3data
- Mole profiles of various species as calculated by Marrone.
- marrone_fig4_??_ratio.g3data
- Flow property profiles (as ratio of free stream values) as calculated by Marrone.
Results files:
- plot-data.gplot
- A Gnuplot input file for plotting of results.
- profile_moles.*
- Plot of mole profiles of air species (as a ratio of original moles).
- profile_T_rho.*
- Plot of temperature and density ratio.
Running the simulation
The steps to running and plotting results are contained in the script: run.sh.
This can be executed at the command line, from this working directory as:
> ./run.sh
Results
The results of the calculation show how the flow properties and species concentrations vary as the flow relaxes downstream of the normal shock. The following figure shows the temperature and density ratio (normalised by free stream values) behind the shock. A comparison to Marrone’s data is shown and the equilibrium state as computed by CEA2 is plotted. The calculation comes to the correct equlibrium values as expected.
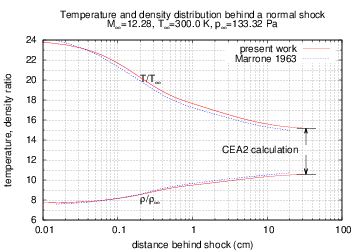
Temperature and density ratio behind a normal shock in air at Mach 12.3.
The next figure shows how the species concentrations change as the chemical reaction proceed behind the shock. Again the comparisons to Marrone’s calculations are shown and the equilibrium concentrations calculated with CEA2. The difference between the present work and Marrone’s results are attributed to differences in the thermodynamic data and reaction rates used in the two calculations.
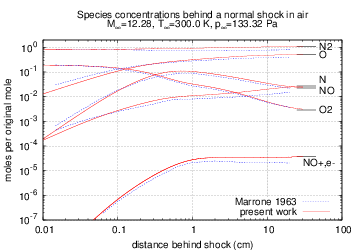
Species concentrations behind a normal shock in air at Mach 12.3.