Comparison with measured spectra from the VKI Minitorch
Description
This calculation uses the photaura spectral radiation model to make comparisons with spectra measured in the VKI Minitorch. The problem description was obtained from the TC4-2 Level 1 test case from the Third International Workshop on Radiation of High Temperature Gases in Atmospheric Entry, 2008. The document WorkshopRadiation2008-TC-4-2-Level1.pdf gives details of the test case.
This example is found in the code collection at:
$CFCFD/examples/photaura/TC4/
Files
User-built files:
- N2-CH4-gas.inp
- Input file for the ‘gasfile’ program to build the gas-model.
- TC4-radiators.py
- Input file for ‘script_rad2.py’ to built the radiation model.
- TC4-validation.py
- Python script that controls the spectral calculation.
- plot_spectra.gnu
- File for ‘gnuplot’ to use to make the plots.
- run.sh
- Shell script that coordinates the calculation.
Output files:
- emissivities_at_??_microns.txt
- Spectral emissivities at various spatial locations.
- plasma-transported-intensity-optically-thin.txt
- Spectral intensity without considering absorption.
- plasma-transported-intensity.txt
- Spectral intensity with absorption considered.
Data files:
- exp_data/??.dat
- Experimental data measurements.
Running the calculation
The calculation is coordinated by the shell script ‘run.sh’. This can be run from the command line via:
$ ./run.sh
Results
The comparisons with the experimental measurements are shown in the figures below. Note that the scaling factors used for the spectral emissivity calculations are those recommended in the test case. Good agreement is shown for all spatial locations and all spectral regions. The plasma is seen to be an absorbing media due to the over estimation of the measured data when considering optically thin transport.
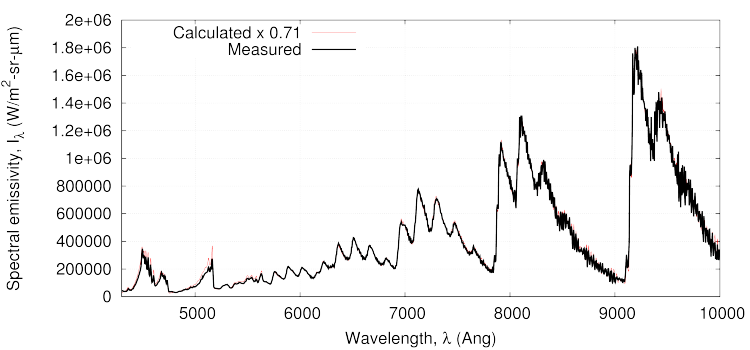
Comparison of calculated and measured spectral emissivity at 1.24 mm from the plasma center.
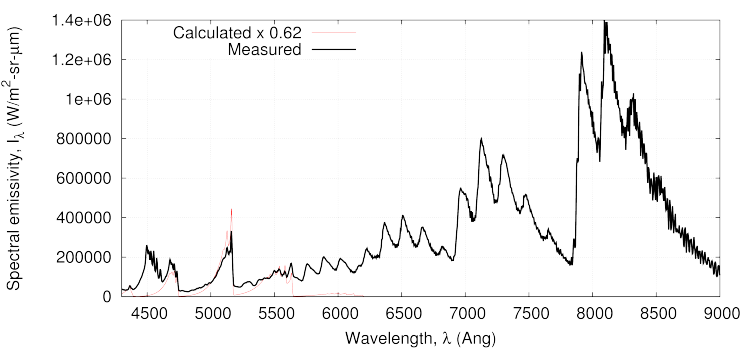
Comparison of calculated and measured spectral emissivity at 3.82 mm from the plasma center.
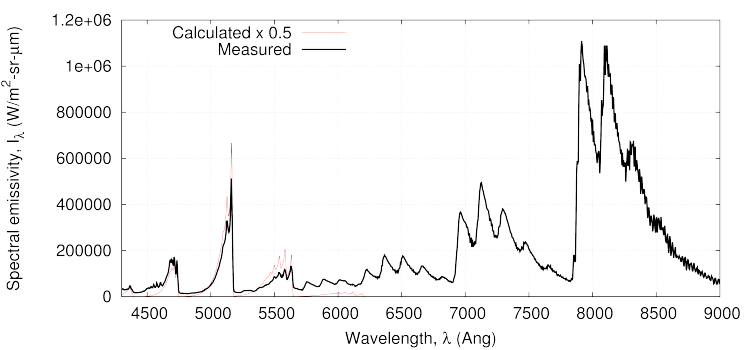
Comparison of calculated and measured spectral emissivity at 8.43 mm from the plasma center.
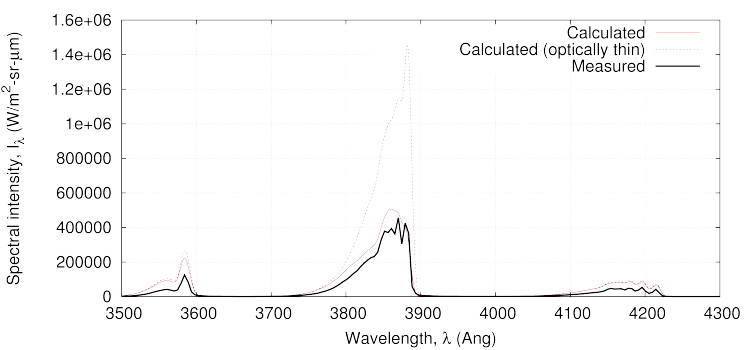
Comparison of calculated and measured spectral intensity in the wavelength range 2500 to 4300 Angstroms.
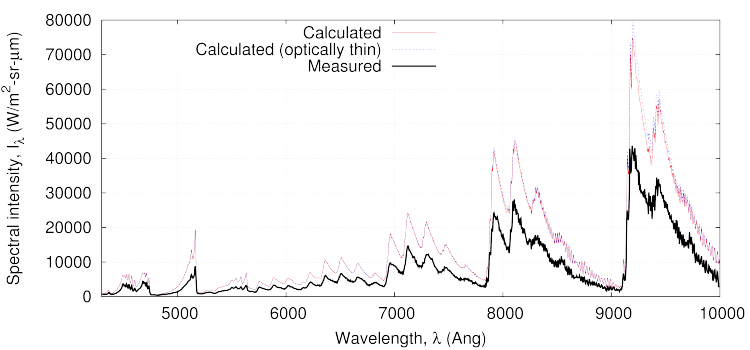
Comparison of calculated and measured spectral intensity in the wavelength range 4300 to 10000 Angstroms.